Four new options such as Last 30 Days, Quarter data, Half year data, and One year data were added to all Reporting Dashboards such as Data Quality Metrics, Data Quality Dimensions, Row Counts Compare, Reconciliations, and Asset Inventory to enable easy data loading. This enhancement is not included in ‘Scenario Execution History’ Dashboard as it loads only the past 30 days data.
To learn more, let us walk through the below procedure:
- Click the ‘REPORTING’ module.
- By default, ‘Data Quality Metrics’ Dashboard is selected.
- Four new button options such as Last 30 Days, Quarter data, Half year data, and One year data are displayed.
Note: By default, ‘Last 30 days’ data is loaded.
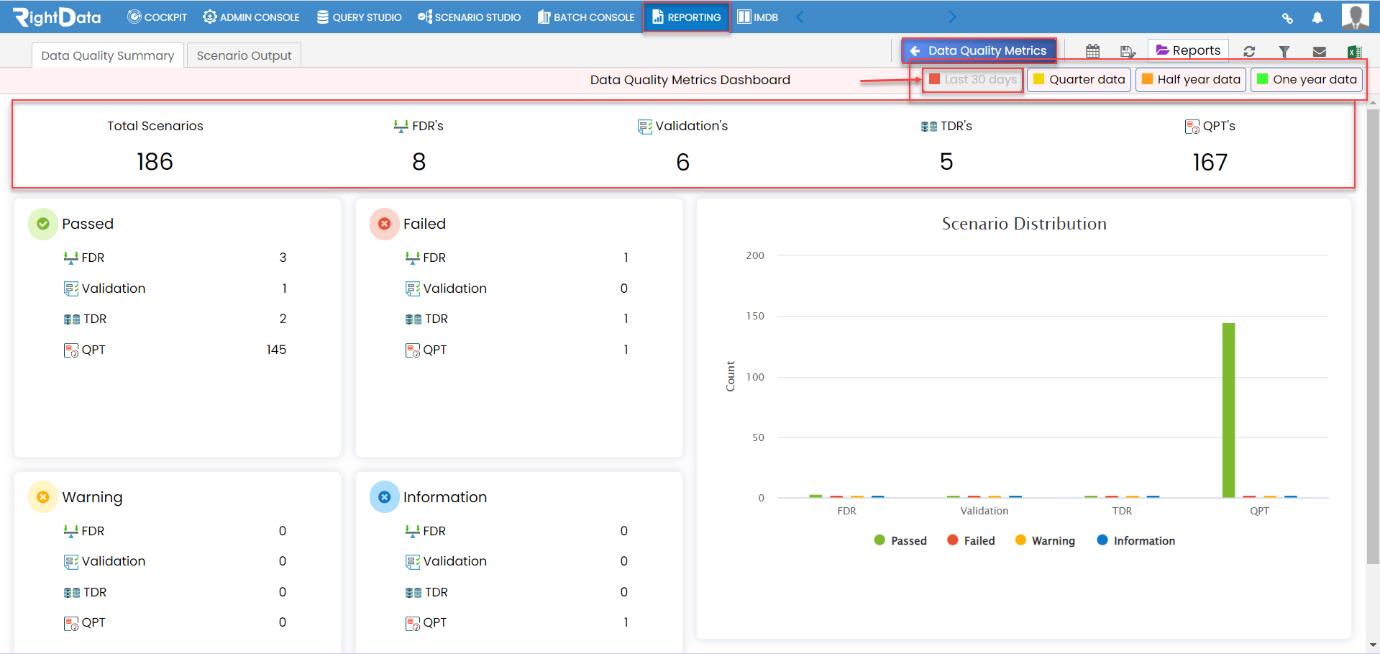
- Now let’s click the ‘Quarter data’ button.

- This action loads the past 3 months data.
- Let’s click the ‘Half year data’ button.
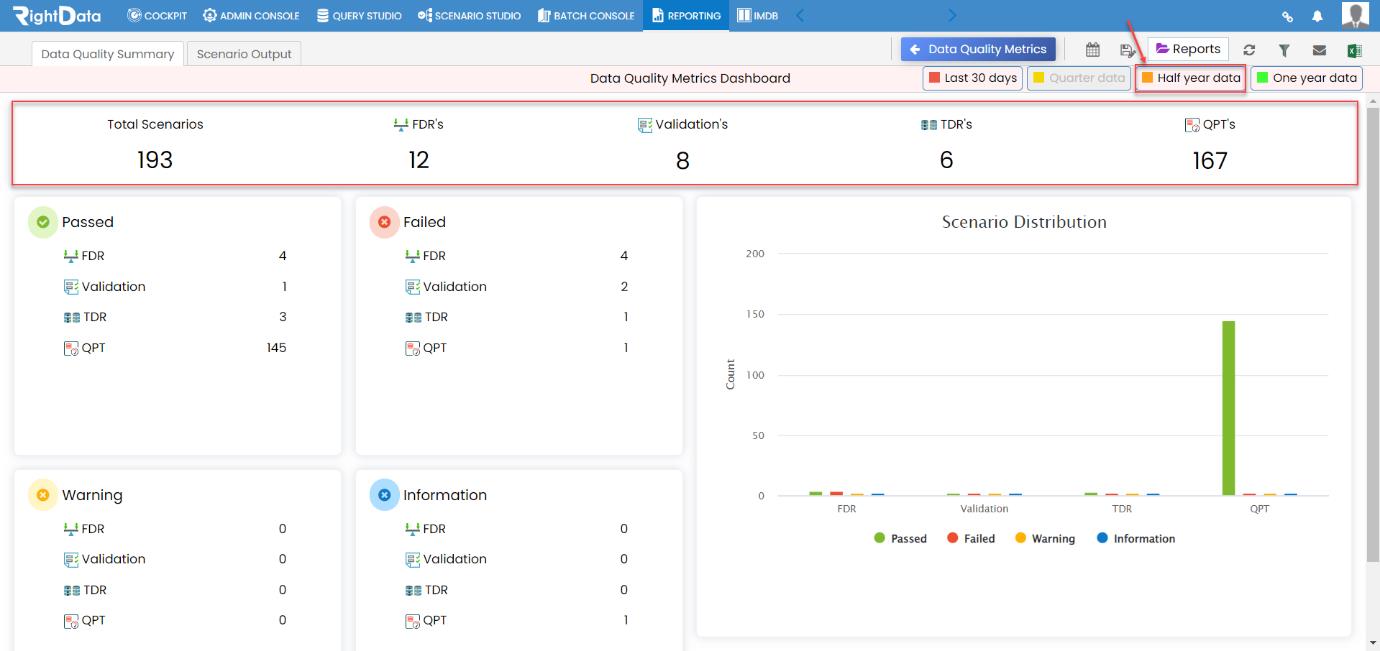
- This action loads the past 6 months data.
- Click the ‘One year data’ button.
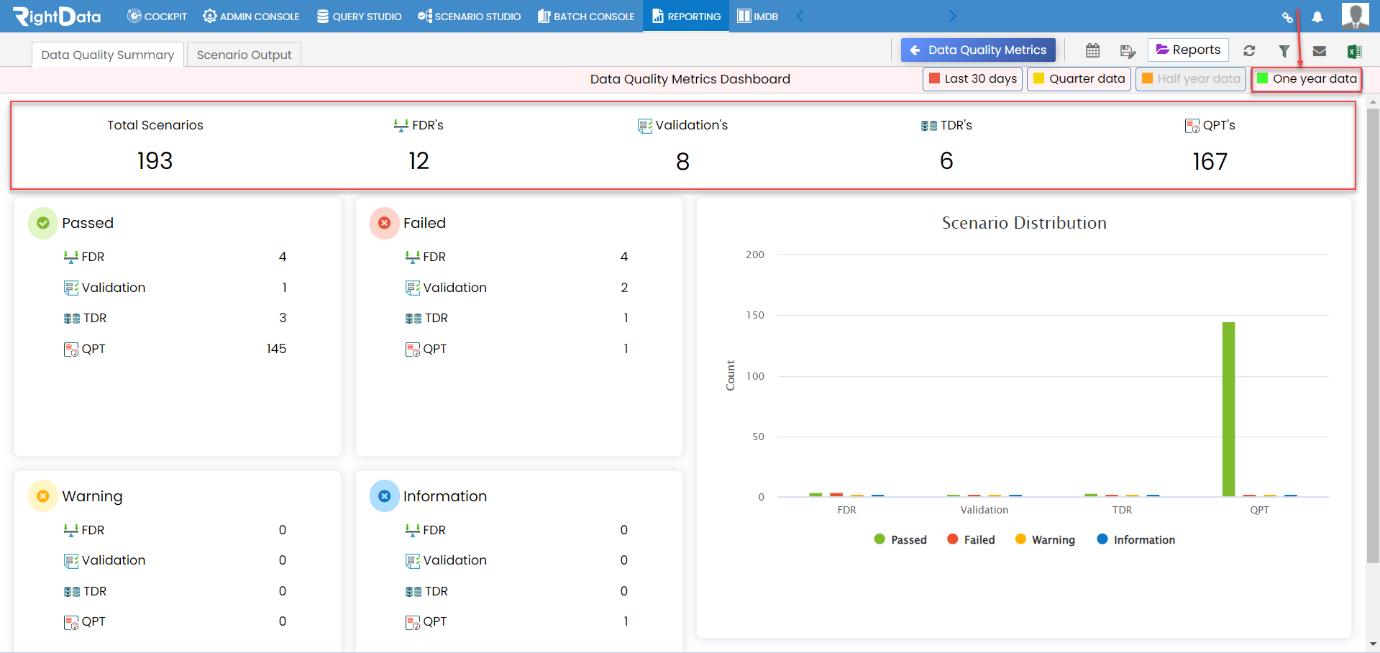
- This action loads the past 12 months data.
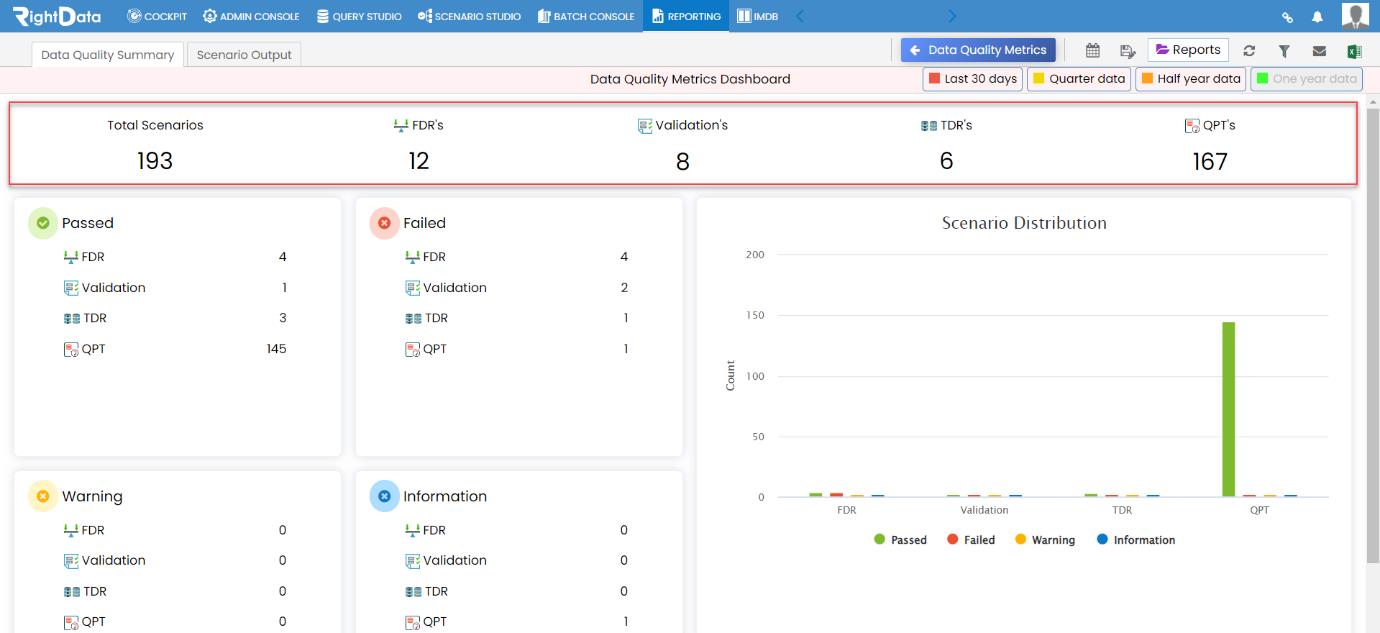
- Click the ‘Pick date range’ button to select the specific date range.

- Let’s suppose, select the date range between 07/01/2020 to 03/22/2022.
- Click the ‘Apply’ button.

- This action loads the specific data selected in-between the dates ‘07/01/2020 to 03/22/2022.’
Note: Similarly, these four options (Last 30 Days, Quarter data, Half year data, and One year data) and ‘Pick date range’ are also included in other Reporting Dashboards such as Data Quality Dimensions, Row Counts Compare, Reconciliations, and Asset Inventory to enable data loading with ease.
